New York Cannabis Sales
Feb, 2026
Overview
New York’s cannabis market has experienced rapid expansion over the past year, with total monthly sales climbing from $40.0M in March 2024 to $163.5M by February 2026. This represents a remarkable year-over-year growth rate of 54.8% for February 2026, far outpacing most established markets. While the market’s early months saw double-digit month-over-month gains, recent months show a moderation, with February 2026 sales down slightly (-2.7%) from January, suggesting the market is entering a more stable phase after its initial surge.
Pricing in New York remains among the highest in the country, with an average item price of $31.29 in February 2026. This is well above the national average and reflects both the premium positioning of many products and the relatively early stage of market development. However, average prices have declined from $35.41 a year prior, indicating increasing competition and greater product variety.

Feb, 2026
Sales
Year Over Year
Growth
Market Comparison
New York’s February 2026 sales of $163.5M place it among the top five cannabis markets in the US, trailing only California ($286.9M) and Michigan ($206.2M) for the month. However, NY’s 54.8% year-over-year growth is the highest among large markets, signaling its rapid catch-up to more mature states. In contrast, established markets like California and Colorado are experiencing year-over-year declines (-6.4% and -8.4%, respectively).
Average item prices in NY ($31.29) are significantly higher than in Michigan ($8.88) and California ($18.44), reflecting both market maturity and product mix. NY’s high pricing may moderate as the market matures and competition intensifies.
New York Weed Prices
| State | Sales ($M) | Avg. Price ($) | YoY Sales Growth | Units Sold (M) |
|---|---|---|---|---|
| California | 286.9 | 18.44 | -6.4% | 15.56 |
| Michigan | 206.2 | 8.88 | -14.8% | 23.22 |
| New York | 163.5 | 31.29 | 54.8% | 5.23 |
| Illinois | 113.3 | 28.47 | -10.2% | 3.98 |
| Massachusetts | 120.0 | 17.69 | -2.3% | 6.78 |
| New Jersey | 83.9 | 31.27 | -2.3% | 2.68 |
| Ohio | 88.6 | 31.24 | 13.9% | 2.84 |
| Colorado | 83.2 | 14.88 | -8.4% | 5.59 |
Category Performance


While Flower and Pre-Rolls dominate sales, the Beverage category stands out for its explosive growth and unique consumer appeal. Beverage sales reached $2.48M in February 2026, up 88.2% year-over-year, with unit sales more than doubling (+134.1%). This growth rate outpaces the overall market and signals strong consumer interest in alternative consumption formats.
Within Beverages, Carbonated drinks lead the segment, followed by “Iced Tea, Lemonade, and Fruit” and Water. Notably, “Tea, Coffee and Hot Cocoa” saw the fastest year-over-year growth (+223.8% in sales, +627.2% in units), albeit from a smaller base. Average item prices in Beverages have dropped significantly, making these products more accessible and likely fueling further adoption.
For a deeper dive into top brands and innovation within New York’s beverage category, Headset Insights can provide detailed brand and SKU-level analysis.
| Segment | Sales ($M) | Units Sold | Avg. Price ($) | YoY Sales Growth |
|---|---|---|---|---|
| Carbonated | 0.72 | 135,803 | 5.30 | 192.4% |
| Iced Tea, Lemonade, and Fruit | 0.52 | 89,039 | 5.82 | 92.8% |
| Water | 0.55 | 102,790 | 5.35 | 25.0% |
| Mocktails | 0.34 | 64,406 | 5.35 | 75.0% |
| Tea, Coffee and Hot Cocoa | 0.15 | 23,074 | 6.41 | 223.8% |
| Drops, Mixes, Elixirs, Syrups | 0.17 | 6,088 | 28.22 | 70.0% |
| Sports and Energy | 0.03 | 2,769 | 9.64 | 44.2% |
Product Category Market Share In New York
Historical Cannabis Sales In New York
New York Cannabis Reports
.png)
New York Marijuana Trends
New York Cannabis News
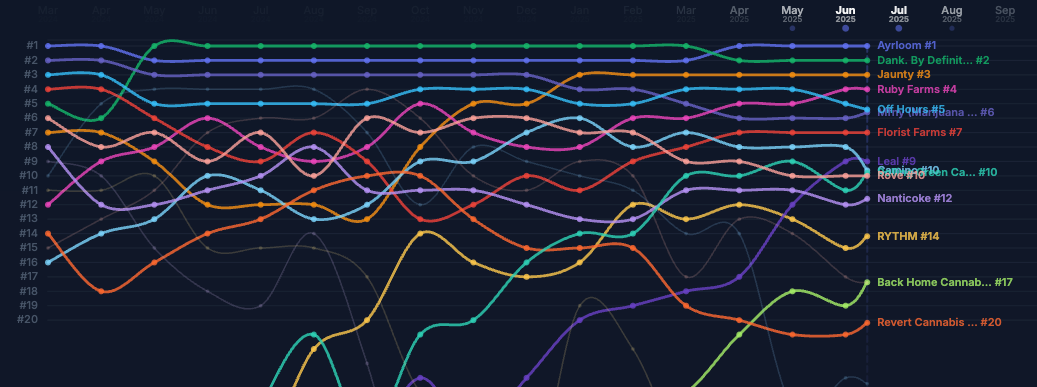
Two Years In: Winners, Losers, and the Brands Reshaping New York Cannabis

mFused × Headset Bridge – Turning Inventory Chaos into a 20% Sales Lift


Get More New York Cannabis Market Data